I’m lazy
And so are most people.
I like to focus on as few things as possible at any given moment and correlation tables get in the way of that.
Correlation tables contain useless data
corrs <- cor(mtcars)

corrplot::corrplot(corrs, order = "hclust")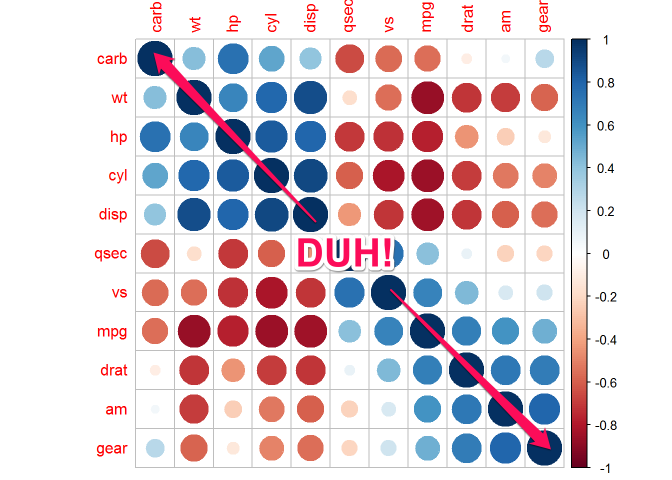
I don’t need to be reminded that each predictor is perfectly correlated with itself.
I guess this could be useful because the border it forms warns me that I am about to see the same exact information for the second time.
Which brings me to…
Correlation tables duplicate information
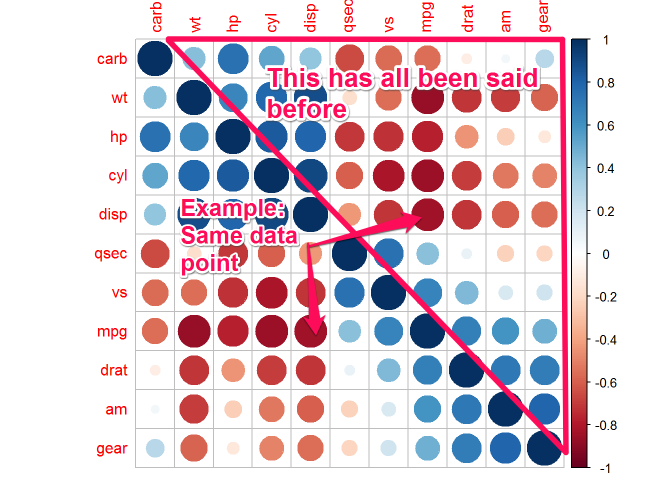
A solution part 1: Eliminate the obvious
After taking a quick look at the table (just the first half :) )to get an idea of the largest correlation values I establish a cut-off point to look at the pairs with the strongest values.
I also remove values where a predictor is correlated with itself.
cut_off <- 0.8

corrs <- cor(mtcars)

# probably *shouldn't* be using melt() here b/c reshape2 is
# depreciated but it
# is easy and I like easy because I am lazy
correlated <- reshape2::melt(corrs) %>%
    dplyr::filter(abs(value) > cut_off,
           #remove entries for a variable correlated to itself
           Var1 != Var2) %>%
    dplyr::arrange(desc(abs(value))) #not necessary just sorting to demo pairwise dups

correlated
## Var1 Var2 value
## 1 disp cyl 0.9020329
## 2 cyl disp 0.9020329
## 3 wt disp 0.8879799
## 4 disp wt 0.8879799
## 5 wt mpg -0.8676594
## 6 mpg wt -0.8676594
## 7 cyl mpg -0.8521620
## 8 mpg cyl -0.8521620
## 9 disp mpg -0.8475514
## 10 mpg disp -0.8475514
## 11 hp cyl 0.8324475
## 12 cyl hp 0.8324475
## 13 vs cyl -0.8108118
## 14 cyl vs -0.8108118Notice each successive pair of rows is a pairwise duplicate.
A solution part 2: Eliminate the duplicates
correlated %>%
    dplyr::mutate(
        combo = dplyr::if_else(
            # > and < comparison doesnt work with factors
            as.character(Var1) > as.character(Var2), #if
                               stringr::str_c(Var1, Var2), #then
                               stringr::str_c(Var2, Var1) #else
        )
    ) %>%
    dplyr::distinct(combo, .keep_all= TRUE) %>%
    dplyr::select(-combo)
## Var1 Var2 value
## 1 disp cyl 0.9020329
## 2 wt disp 0.8879799
## 3 wt mpg -0.8676594
## 4 cyl mpg -0.8521620
## 5 disp mpg -0.8475514
## 6 hp cyl 0.8324475
## 7 vs cyl -0.8108118There you have it - only the unique predictor pairs!
I arrived at this solution after finding this stackoverflow post
If you found this useful
You may like my cheat sheet.